Rolling rainfall analysis — Mahé episode 3–10 September 2026
Generated 2026-09-10 18:57 UTC. Source: smaone.davis_met_data_type_1.
Fields used: rainfall_last_15_min_mm, rainfall_last_60_min_mm,
rainfall_last_24_hr_mm (15-min and 60-min / 24-h are sliding windows).
No summing of 15-min buckets for daily totals.
Climatology = distribution of daily maxima of each rolling field (May 2023 – 2 Sep 2026).
1. Summary
This report analyses the episode through the three rolling rainfall products
reported by Davis stations, without reconstructing calendar-day accumulations by summing
15-minute increments.
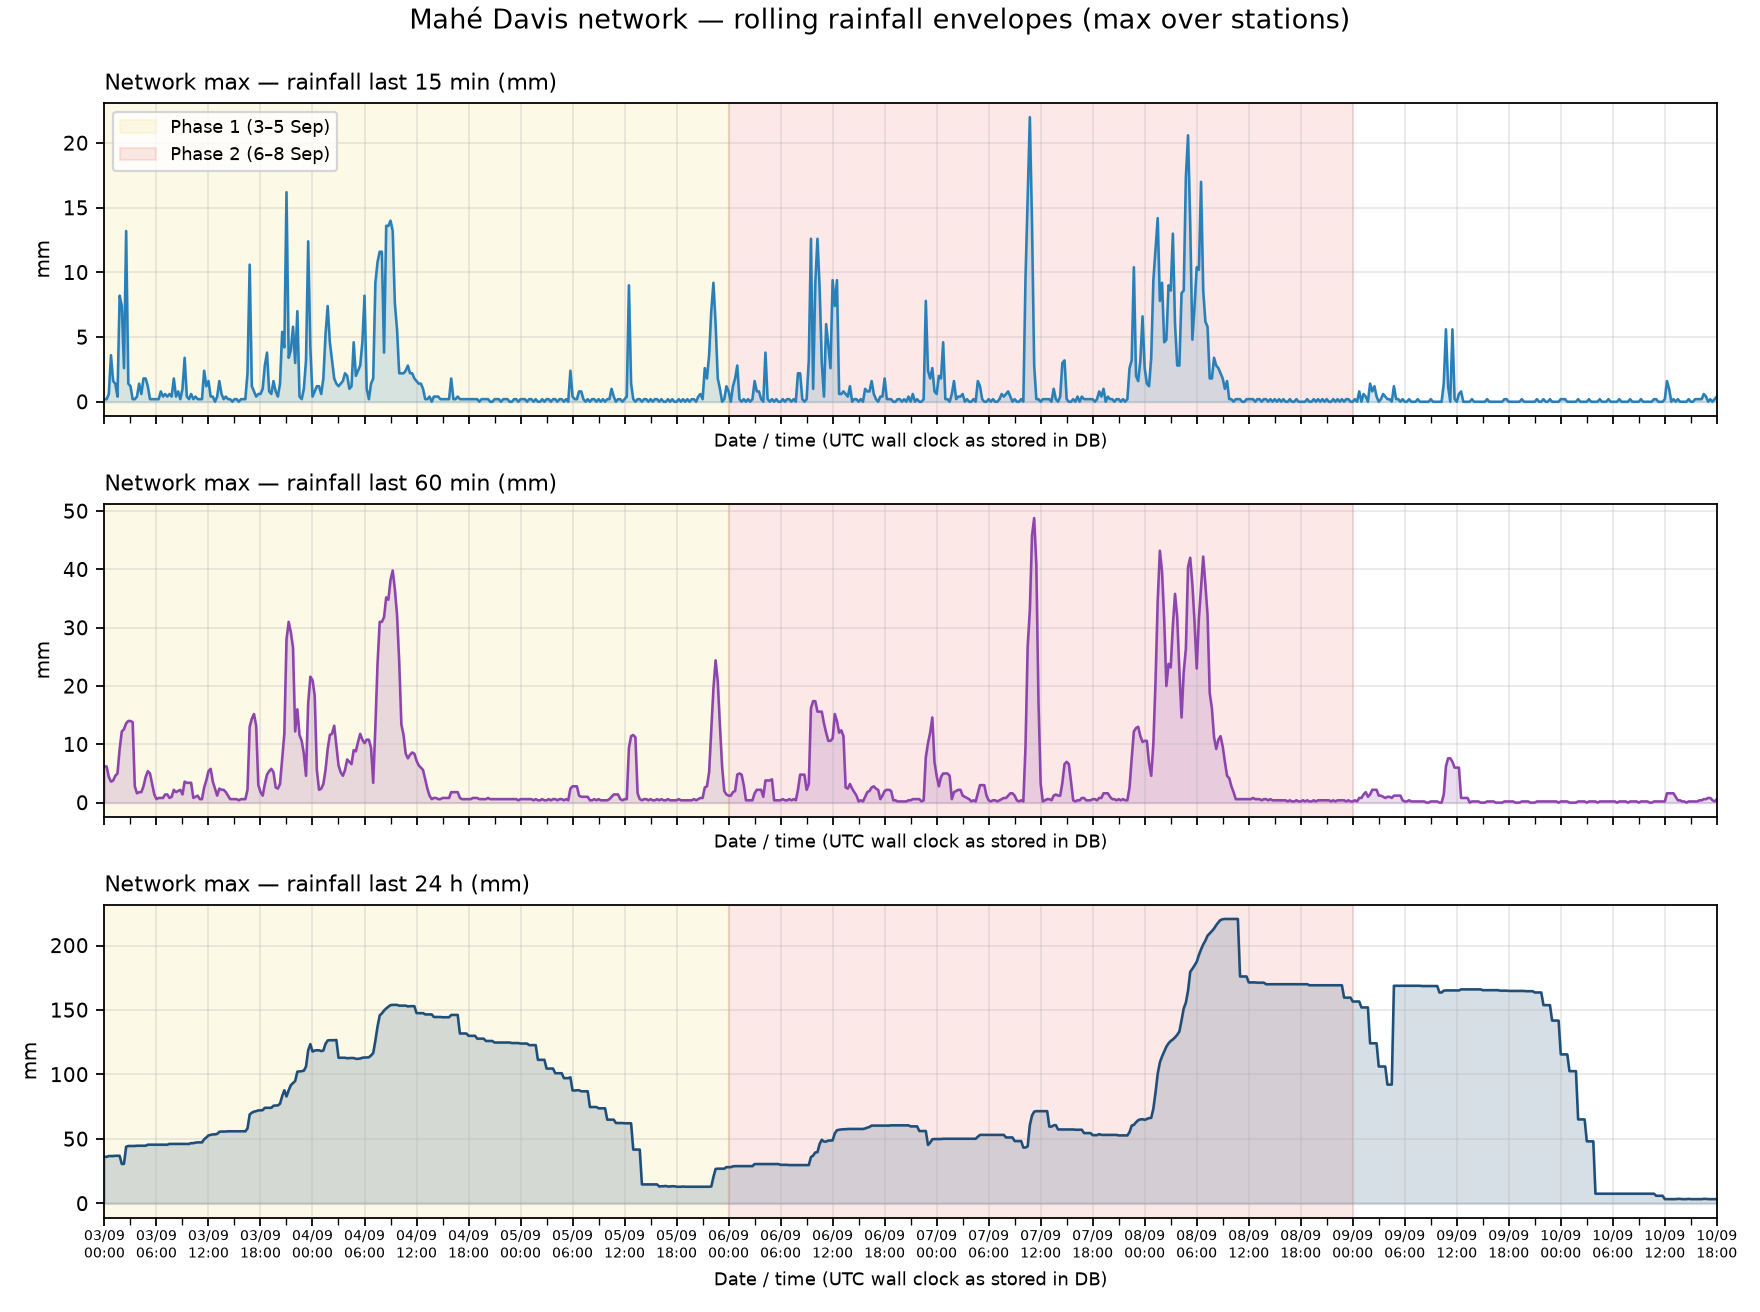
Phase 1 (3–5 Sep) and Phase 2 (6–8 Sep) remain visible in the rolling envelopes;
Phase 2 generally reaches higher peaks, especially for 60-min and 24-h windows.
Network peak last-15-min: 22.0 mm at 2026-09-07 10:45.
Network peak last-60-min: 48.8 mm at 2026-09-07 11:15.
Network peak last-24-h: 220.6 mm at 2026-09-08 09:15.
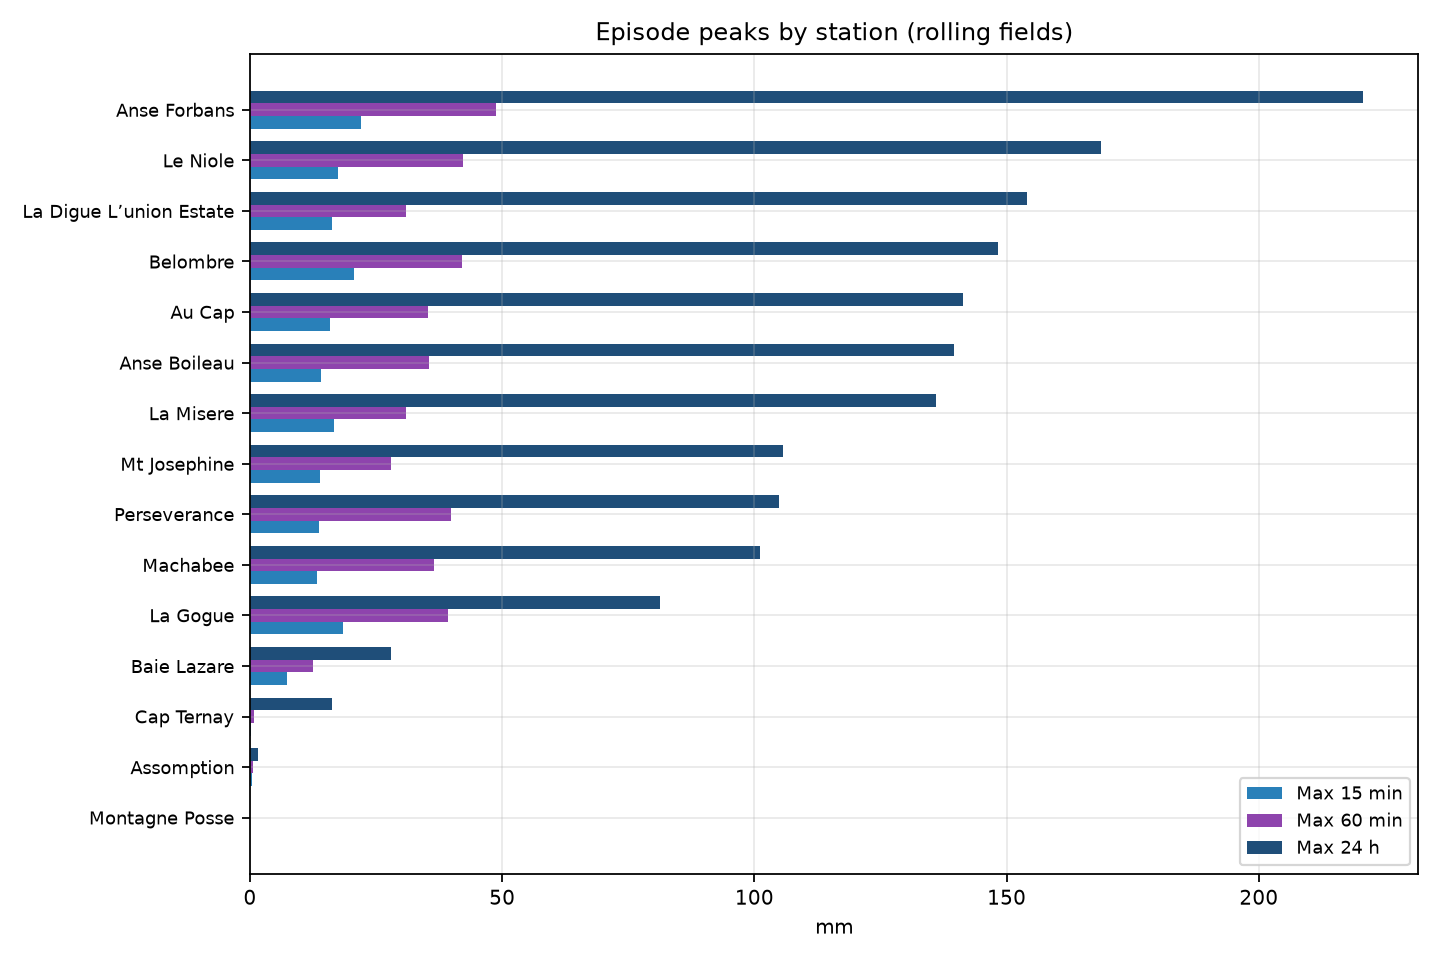
Highest station peak 24-h: Anse Forbans — 220.6 mm
at 2026-09-08 09:15.
Highest station peak 60-min: Anse Forbans — 48.8 mm.
Highest station peak 15-min: Anse Forbans — 22.0 mm.
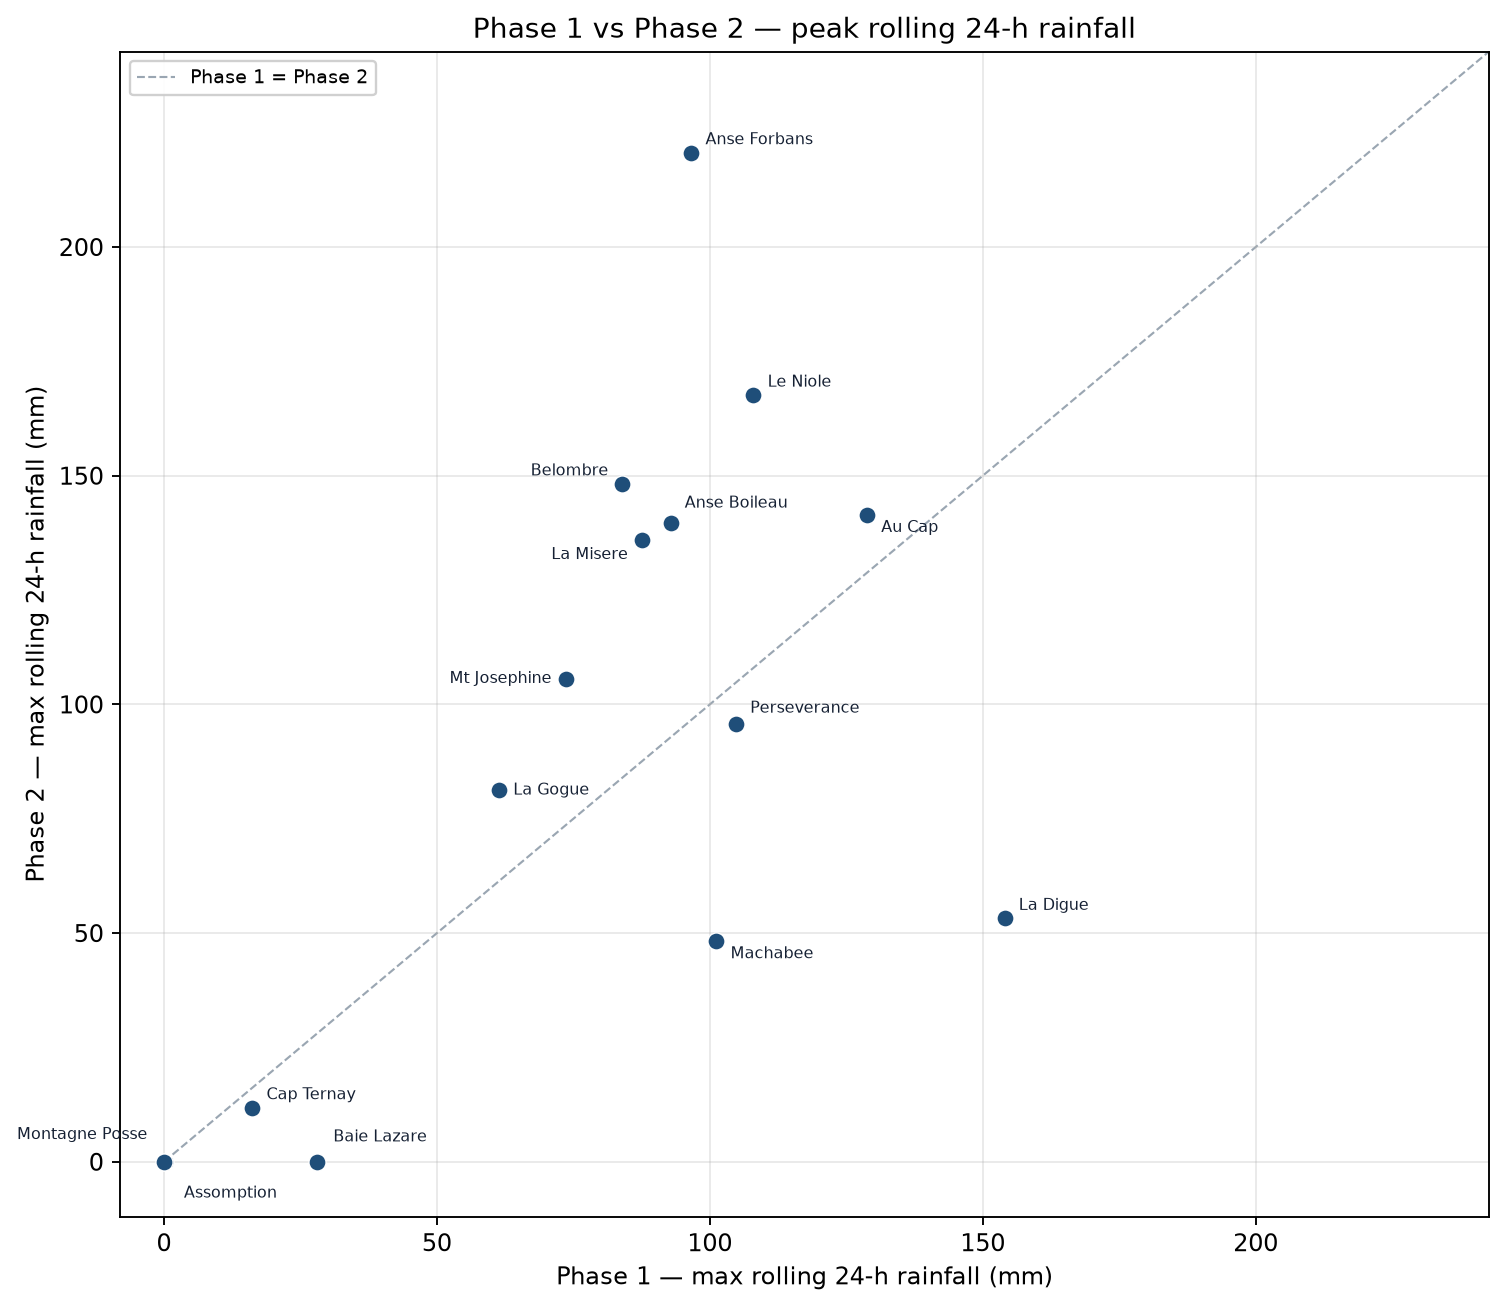
For 8/15 stations, Phase-2 max(rolling 24 h) exceeds Phase-1.
Interpretation note: a large last-24-h value on a given clock time includes rain
that may have fallen during the previous calendar day. Peaks of the 24-h curve therefore lag
intense rainfall pulses; 15-min and 60-min curves locate intensity more sharply in time.
2. Network evolution (date/time on x-axis)
At each time step, the curves below show the maximum value across all stations
on the Mahé Davis network for the corresponding rolling field
(last 15 min, last 60 min, or last 24 h). They are therefore a
network envelope, not the continuous record of a single site:
the station that provides the maximum may change from one hour to the next
(for example Anse Forbans at one time, another station later).
This view is useful to see when the network as a whole experienced its strongest
rolling rainfall amounts and to outline the temporal structure of the episode
(Phase 1 / Phase 2, peaks and lulls) without choosing one station in advance.
It does not represent a spatial rainfall total, nor the hyetograph of a given location.
For a site-specific time series, see the station panels later in this report.
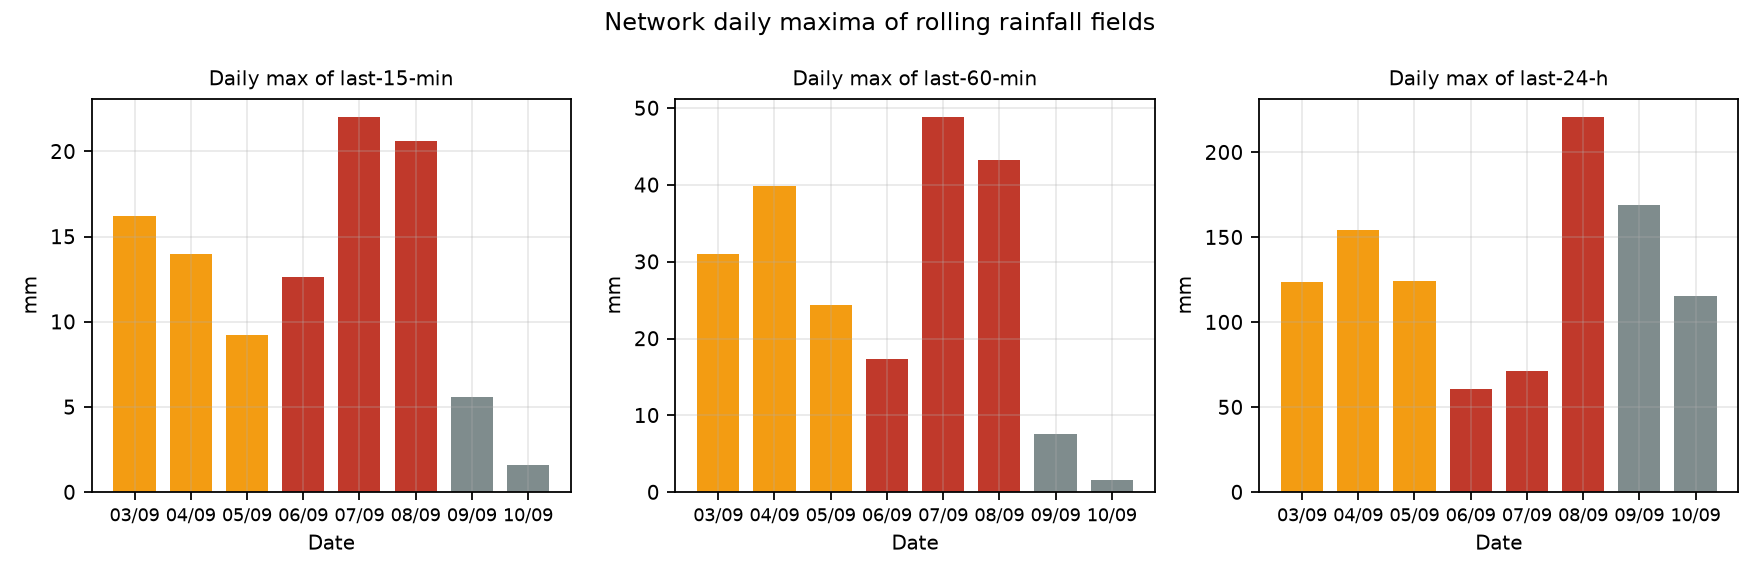
Figure 1 — Network maximum of each rolling field over time (tick marks: date and hour).Figure 2 — Daily maximum of each rolling field on the network (date on x-axis).
Table 1 — Network daily maxima of rolling fields
Day
Max 15 min
Max 60 min
Max 24 h
2026-09-03
16.2
31.0
123.6
2026-09-04
14.0
39.8
154.0
2026-09-05
9.2
24.4
124.0
2026-09-06
12.6
17.4
60.6
2026-09-07
22.0
48.8
71.6
2026-09-08
20.6
43.2
220.6
2026-09-09
5.6
7.6
168.8
2026-09-10
1.6
1.6
115.6
3. Station peaks
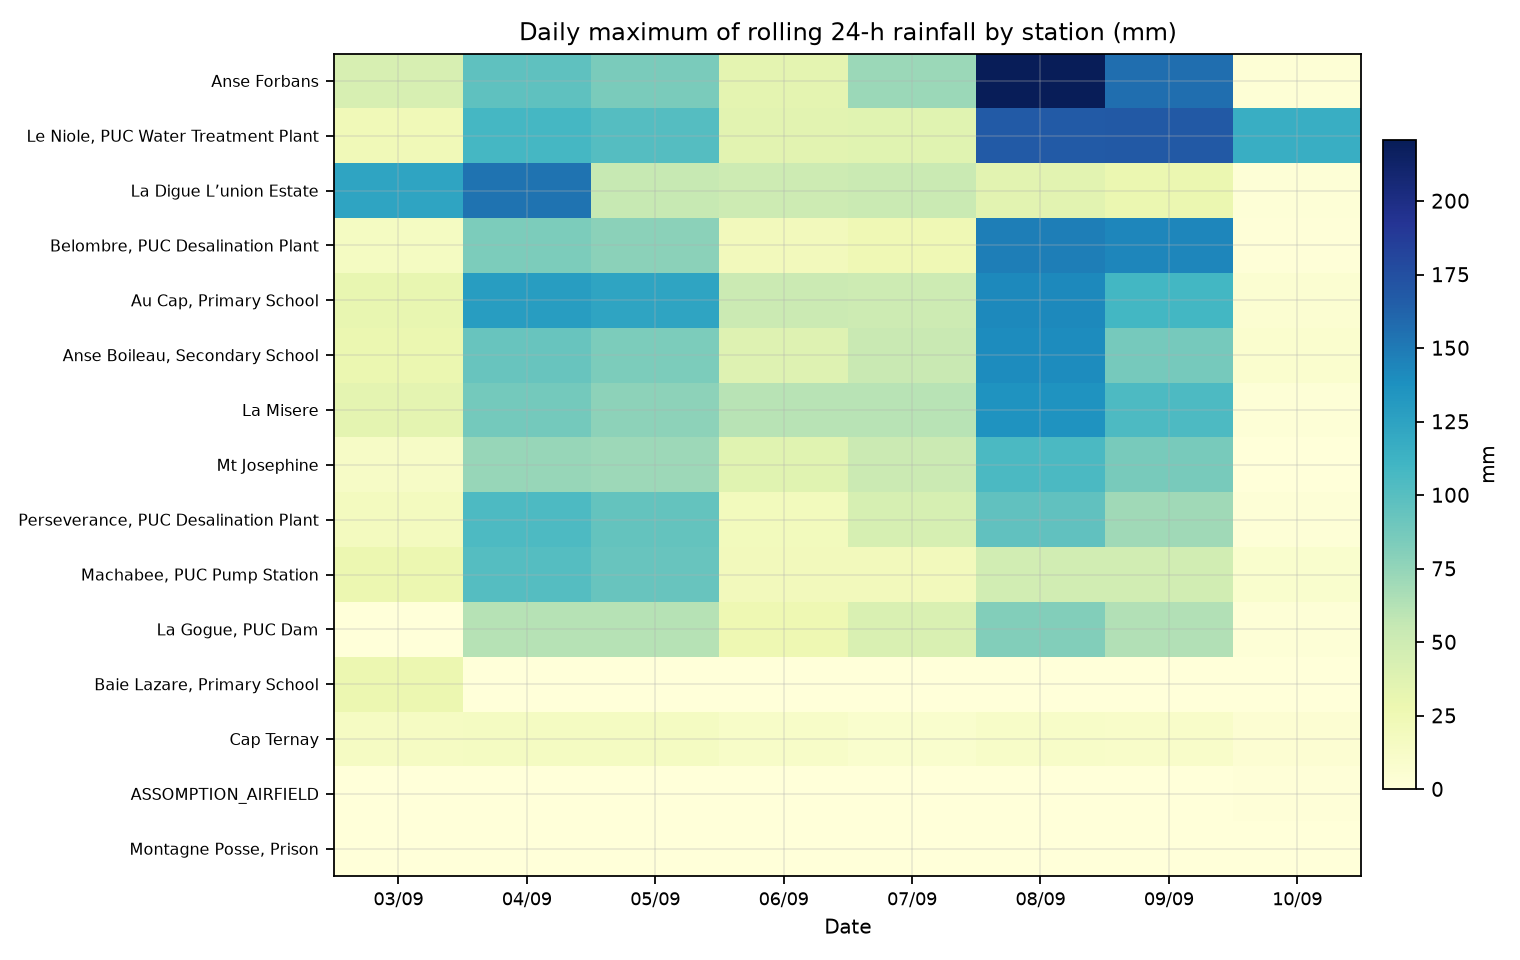
Figure 3 — Episode peaks (15 min / 60 min / 24 h) by station.Figure 4 — Daily maximum of rolling 24-h rainfall (station × date).Figure 5 — Phase 1 vs Phase 2 peak rolling 24-h rainfall (station names).
This scatter plot compares, for each station, the highest rolling 24-h rainfall
reached during Phase 1 (3–5 Sep, x-axis) with that reached during Phase 2 (6–8 Sep, y-axis).
The dashed line is the 1:1 reference: points above the line had a stronger Phase-2 peak,
points below had a stronger Phase-1 peak. It is a compact way to see whether the second
pulse was more severe locally, and how that contrast varies across Mahé (and La Digue),
without looking at full time series for every site.
Table 2 — Episode peaks and timing by station
ID
Station
Max 15'
Time 15'
Max 60'
Time 60'
Max 24h
Time 24h
P1 max24
P2 max24
160367
Anse Forbans
22.0
09-07 10:45
48.8
09-07 11:15
220.6
09-08 09:15
96.6
220.6
182638
Le Niole, PUC Water Treatment Plant
17.4
09-08 04:45
42.2
09-08 06:45
168.8
09-09 04:45
108.0
167.6
235303
La Digue L’union Estate
16.2
09-03 21:00
31.0
09-03 21:15
154.0
09-04 09:15
154.0
53.2
160488
Belombre, PUC Desalination Plant
20.6
09-08 05:00
42.0
09-08 05:15
148.2
09-08 09:45
84.0
148.2
160577
Au Cap, Primary School
15.8
09-07 10:30
35.2
09-04 08:30
141.4
09-08 09:15
128.8
141.4
160371
Anse Boileau, Secondary School
14.0
09-07 10:45
35.4
09-07 11:00
139.6
09-08 09:30
92.8
139.6
160495
La Misere
16.6
09-07 10:45
31.0
09-08 06:30
136.0
09-08 09:30
87.6
136.0
141336
Mt Josephine
13.8
09-07 10:45
28.0
09-08 06:30
105.6
09-08 09:45
73.6
105.6
160590
Perseverance, PUC Desalination Plant
13.6
09-04 08:45
39.8
09-04 09:15
104.8
09-04 12:30
104.8
95.8
141341
Machabee, PUC Pump Station
13.2
09-04 09:15
36.4
09-04 09:15
101.2
09-04 12:45
101.2
48.2
160481
La Gogue, PUC Dam
18.4
09-08 05:00
39.2
09-04 09:15
81.2
09-08 09:30
61.4
81.2
160369
Baie Lazare, Primary School
7.4
09-03 02:00
12.4
09-03 02:30
28.0
09-03 04:45
28.0
—
144017
Cap Ternay
0.2
09-03 00:00
0.8
09-03 00:45
16.2
09-04 20:45
16.2
11.8
211422
ASSOMPTION_AIRFIELD
0.4
09-10 12:15
0.6
09-10 13:00
1.6
09-10 13:30
0.2
0.0
160574
Montagne Posse, Prison
0.0
09-03 00:00
0.0
09-03 00:00
0.0
09-03 00:00
0.0
0.0
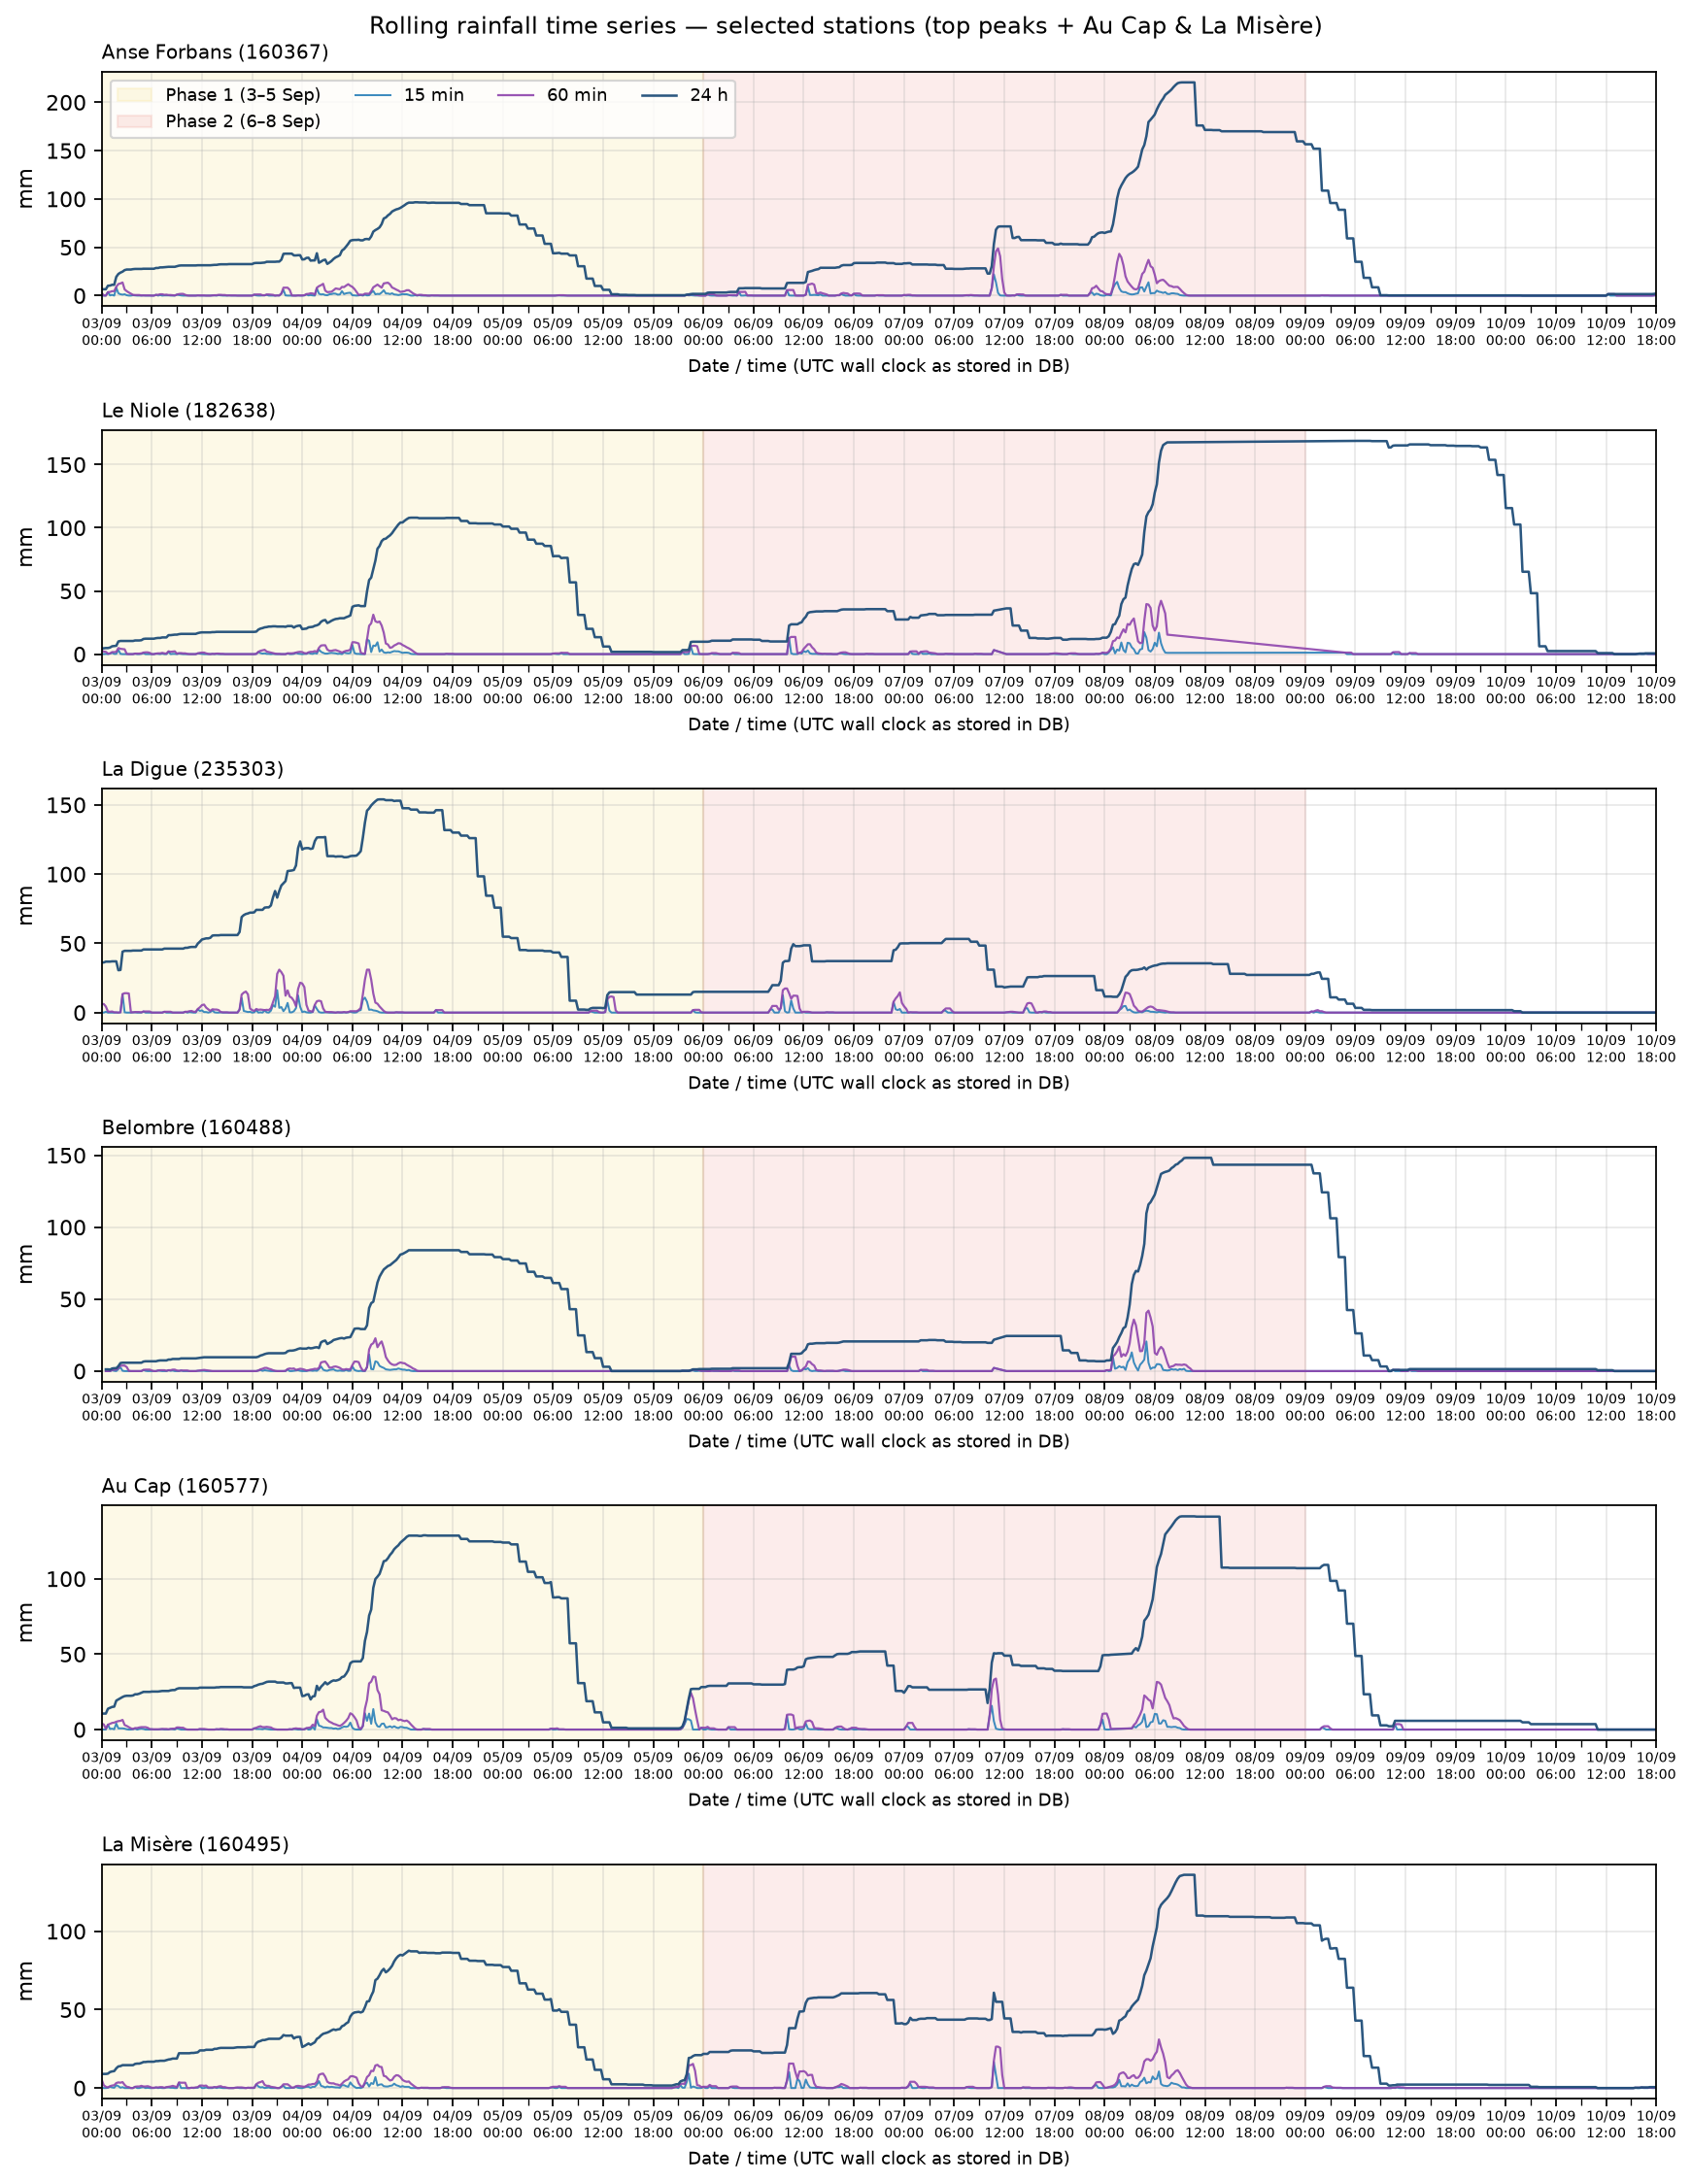
Figure 6 — Rolling 15-min / 60-min / 24-h series for selected stations
(four highest peak 24-h rainfall stations, plus Au Cap and La Misère; date/time ticks).
4. Climatological comparison
For each station, climatology is the distribution of daily maxima of each rolling field
(not summed 15-min totals). The episode is represented by its own daily maxima of those fields.
Mean, standard deviation, variance and quintiles (Q20–Q80) are given primarily for the
rolling 24-h product; z-scores/percentiles are also shown for 15-min and 60-min peaks.
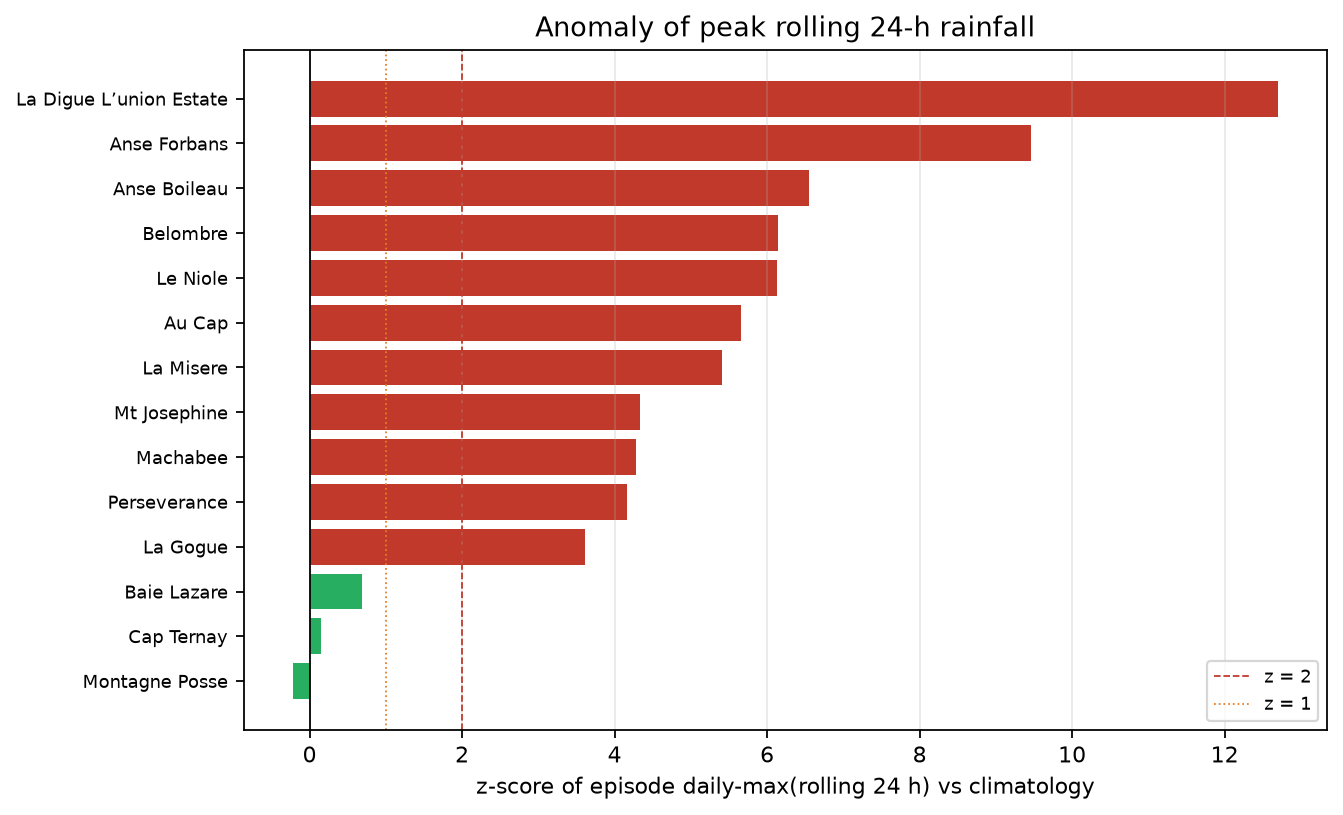
Figure 7 — z-score of episode daily-max(rolling 24 h) versus climatology (Assomption excluded).
This chart ranks stations by how unusual their episode peak was, relative to their own recent history.
For each station, we take the highest daily maximum of the rolling 24-h rainfall during the episode,
then compare it with the climatological distribution of that same daily-max quantity
(May 2023 – early September 2026, excluding the episode).
The plotted value is the z-score:
z = (episode value − climatological mean) / climatological standard deviation.
Roughly, z ≈ 0 means near average; z ≥ 1 means above about one standard deviation
(uncommon); z ≥ 2 means a rare peak for that station in this sample.
Colours follow the same thresholds (green / orange / red). Because the historical sample is short
(~3 years), these z-scores are sample-relative, not formal return periods.
In a future study, the climatological baseline could be extended using
CHIRPS rainfall estimates, which would provide a much longer historical depth,
even though CHIRPS is a satellite-based (not gauge) product.
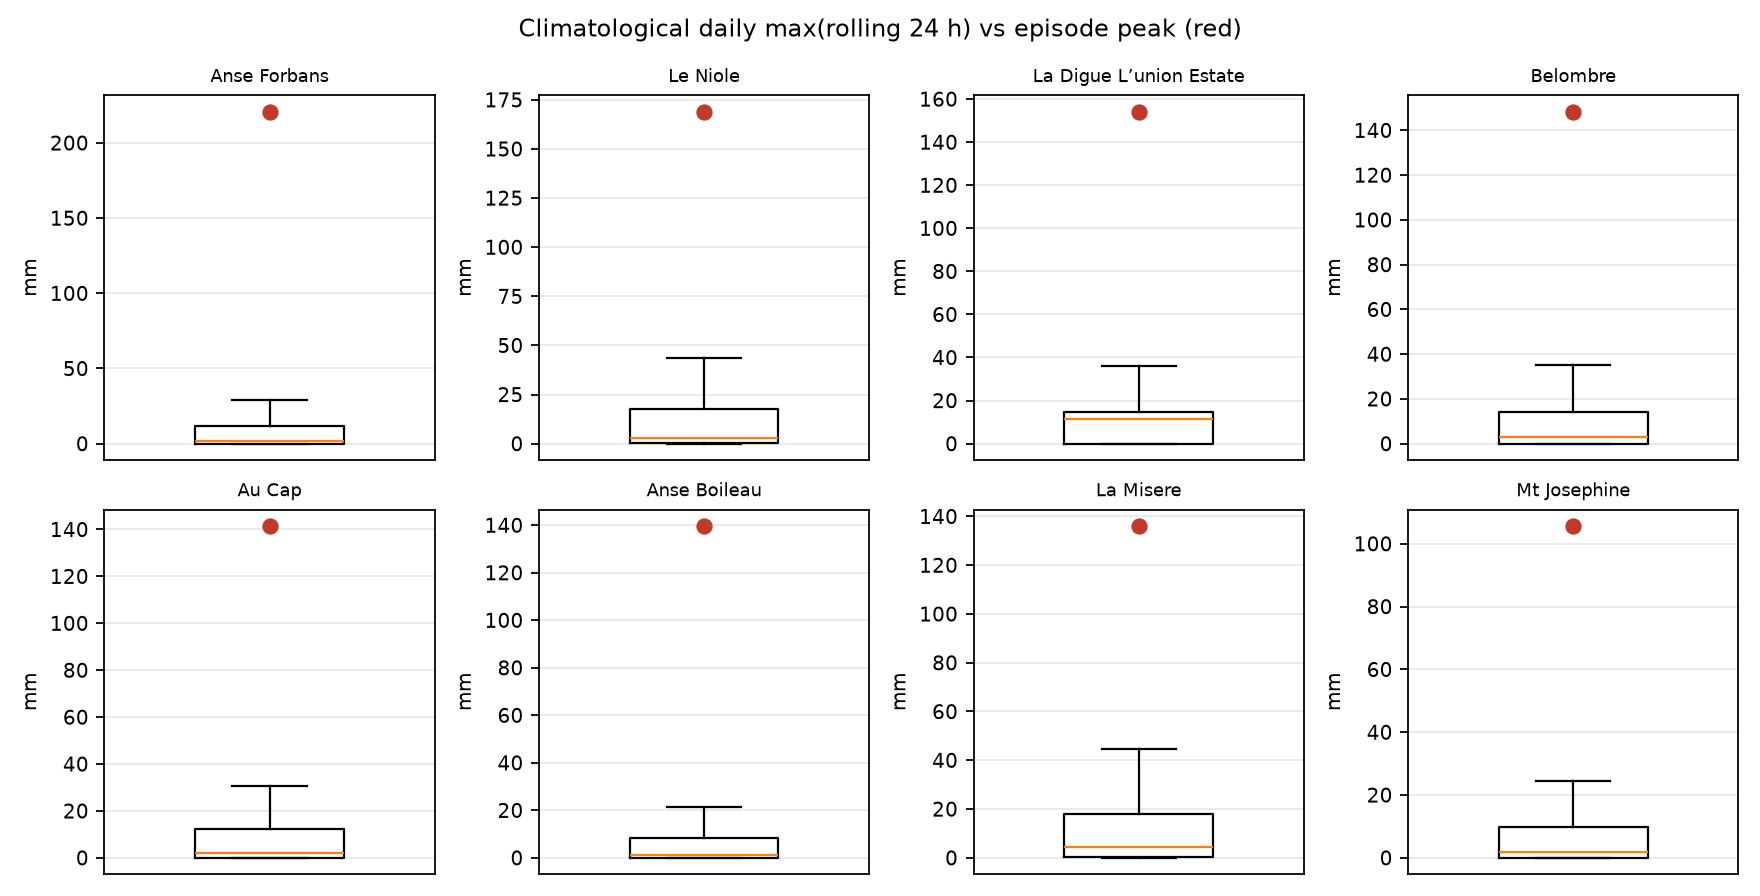
Figure 8 — Climatological daily max(rolling 24 h); red point = episode peak day.
Each panel is a boxplot of the station’s climatological distribution of
daily maxima of rolling 24-h rainfall (outliers hidden to keep the scale readable).
The box spans the interquartile range (IQR): from the 25th percentile (bottom)
to the 75th percentile (top). Half of the historical days fall inside this box.
The orange/yellow line inside the box is the median (50th percentile):
half of the days are below it, half above. It is a robust “typical” level, less sensitive
to extreme wet days than the mean.
The vertical lines (whiskers) ending with a small cap (“hat”) extend to the
furthest non-outlier values (here up to about 1.5 × IQR from the box). They show the
usual spread beyond the central half of the data, without plotting the most extreme
historical outliers.
How to read it: a compact box near zero means most days have small rolling-24-h maxima;
a taller box means more day-to-day variability. The red point is the episode’s own
peak daily max(rolling 24 h) for that station. Its position is the key message:
if it sits near the median/box, the episode peak was fairly ordinary for that site;
if it lies well above the upper whisker (or far above the box), the peak was exceptional
relative to the recent local climatology — i.e. rare in this sample.
Table 3 — Climatology of daily max(rolling 24 h)
All climatological columns below refer to the distribution of
daily maxima of rolling 24-h rainfall at each station
(May 2023 – early September 2026, episode days excluded), in mm unless noted.
Station — station name.
Ep. day-max 24h — highest daily maximum of the rolling 24-h field during the episode
(the value compared with climatology).
Mean — climatological average of daily max(rolling 24 h).
σ — climatological standard deviation of that daily-max series
(spread around the mean).
Var — variance (= σ²), another measure of spread.
Q20 / Q40 / Q60 / Q80 — empirical quintiles (20th, 40th, 60th and 80th percentiles)
of the climatological daily-max distribution.
Clim. max — largest daily max(rolling 24 h) in the climatological sample.
z — z-score of the episode day-max versus climatology:
(Ep. day-max 24h − Mean) / σ.
Pct — percentile rank of the episode day-max in the climatological sample
(100 ≈ at or above every historical day in the sample).
Formula:
Pct = 100 × (number of climatological days with value ≤ episode day-max) / n.
n — number of climatological days used for that station.
Station
Ep. day-max 24h
Mean
σ
Var
Q20
Q40
Q60
Q80
Clim. max
z
Pct
n
Anse Forbans
220.6
11.6
22.1
487.9
0.0
0.8
3.7
16.8
163.0
9.5
100.0
1162
Le Niole, PUC Water Treatment Plant
168.8
14.2
25.2
636.6
0.0
1.4
6.4
24.1
292.4
6.1
99.8
1172
Belombre, PUC Desalination Plant
148.2
12.2
22.2
491.0
0.0
1.2
5.4
18.4
180.0
6.1
99.7
1149
Au Cap, Primary School
141.4
12.4
22.8
519.1
0.0
1.0
4.6
18.6
138.0
5.7
100.0
1080
Anse Boileau, Secondary School
139.6
9.8
19.8
392.7
0.0
0.2
2.8
12.0
133.0
6.5
100.0
1146
La Misere
136.0
14.2
22.5
506.6
0.0
2.2
8.0
24.8
132.0
5.4
100.0
1063
Mt Josephine
105.6
10.9
21.8
476.5
0.0
0.6
4.0
14.8
160.0
4.3
99.0
1194
Perseverance, PUC Desalination Plant
104.8
11.3
22.5
505.5
0.0
0.4
3.0
17.5
204.4
4.2
99.5
1138
Machabee, PUC Pump Station
101.2
10.2
21.3
452.3
0.0
0.2
2.6
15.0
194.6
4.3
99.1
1113
La Gogue, PUC Dam
81.2
9.3
19.9
396.7
0.0
0.2
2.6
11.2
195.0
3.6
98.3
1116
Baie Lazare, Primary School
28.0
12.2
23.0
530.0
0.0
1.0
4.8
18.1
211.6
0.7
85.7
1147
Cap Ternay
16.2
13.0
22.0
483.0
0.0
1.4
6.2
21.4
163.8
0.1
76.6
1123
Montagne Posse, Prison
0.0
0.6
2.9
8.5
0.0
0.0
0.0
0.0
33.8
-0.2
84.3
1128
Table 4 — Episode peaks vs climatology (15 / 60 / 24 h)
Station
Ep. max15
z15
Pct15
Ep. max60
z60
Pct60
Ep. max24
z24
Pct24
Anse Forbans
22.0
5.5
99.6
48.8
5.4
99.4
220.6
9.5
100.0
Le Niole, PUC Water Treatment Plant
17.4
4.4
99.0
42.2
4.8
99.4
168.8
6.1
99.8
Belombre, PUC Desalination Plant
20.6
5.1
99.2
42.0
4.4
98.9
148.2
6.1
99.7
Au Cap, Primary School
15.8
3.6
98.1
35.2
3.4
97.8
141.4
5.7
100.0
Anse Boileau, Secondary School
14.0
3.7
98.3
35.4
4.3
98.8
139.6
6.5
100.0
La Misere
16.6
4.0
98.9
31.0
3.3
97.9
136.0
5.4
100.0
Mt Josephine
13.8
3.6
98.3
28.0
3.2
97.2
105.6
4.3
99.0
Perseverance, PUC Desalination Plant
13.6
3.3
97.9
39.8
4.4
98.7
104.8
4.2
99.5
Machabee, PUC Pump Station
13.2
3.4
98.0
36.4
4.2
98.7
101.2
4.3
99.1
La Gogue, PUC Dam
18.4
5.5
99.6
39.2
5.3
99.4
81.2
3.6
98.3
Baie Lazare, Primary School
7.4
1.5
92.0
12.4
1.1
91.3
28.0
0.7
85.7
Cap Ternay
0.2
-0.5
51.9
0.8
-0.4
56.9
16.2
0.1
76.6
Montagne Posse, Prison
0.0
-0.2
90.0
0.0
-0.2
89.4
0.0
-0.2
84.3
5. Station sheets
Anse Boileau, Secondary School (ID 160371)
Episode peaks (rolling):
15 min = 14.0 mm at 2026-09-07 10:45;
60 min = 35.4 mm at 2026-09-07 11:00;
24 h = 139.6 mm at 2026-09-08 09:30.
Phase peaks of rolling 24 h:
Phase 1 = 92.8 mm;
Phase 2 = 139.6 mm.
Climatology of daily maximum of rolling 24-h rainfall
(n=1146):
mean=9.82 mm; σ=19.82 mm; var=392.67;
Q20/Q40/Q60/Q80 =
0.0/0.2/2.8/12.0 mm.
Episode day-max 24 h = 139.6 mm
(percentile ≈ 100%; z ≈ 6.55).
Day
Max 15'
Max 60'
Max 24h
2026-09-03
2.8
7.0
28.6
2026-09-04
6.0
17.8
92.8
2026-09-05
6.2
13.8
84.4
2026-09-06
5.2
7.8
38.2
2026-09-07
14.0
35.4
54.0
2026-09-08
5.6
18.0
139.6
2026-09-09
5.6
7.6
86.6
2026-09-10
1.0
1.0
7.6
Anse Forbans (ID 160367)
Episode peaks (rolling):
15 min = 22.0 mm at 2026-09-07 10:45;
60 min = 48.8 mm at 2026-09-07 11:15;
24 h = 220.6 mm at 2026-09-08 09:15.
Phase peaks of rolling 24 h:
Phase 1 = 96.6 mm;
Phase 2 = 220.6 mm.
Climatology of daily maximum of rolling 24-h rainfall
(n=1162):
mean=11.63 mm; σ=22.09 mm; var=487.87;
Q20/Q40/Q60/Q80 =
0.0/0.8/3.7/16.8 mm.
Episode day-max 24 h = 220.6 mm
(percentile ≈ 100%; z ≈ 9.46).
Day
Max 15'
Max 60'
Max 24h
2026-09-03
8.2
13.6
43.4
2026-09-04
7.4
13.4
96.6
2026-09-05
0.6
1.4
85.0
2026-09-06
9.4
12.4
34.2
2026-09-07
22.0
48.8
71.6
2026-09-08
14.2
43.2
220.6
2026-09-09
0.2
0.2
156.6
2026-09-10
1.6
1.6
3.2
Au Cap, Primary School (ID 160577)
Episode peaks (rolling):
15 min = 15.8 mm at 2026-09-07 10:30;
60 min = 35.2 mm at 2026-09-04 08:30;
24 h = 141.4 mm at 2026-09-08 09:15.
Phase peaks of rolling 24 h:
Phase 1 = 128.8 mm;
Phase 2 = 141.4 mm.
Climatology of daily maximum of rolling 24-h rainfall
(n=1080):
mean=12.42 mm; σ=22.78 mm; var=519.11;
Q20/Q40/Q60/Q80 =
0.0/1.0/4.6/18.6 mm.
Episode day-max 24 h = 141.4 mm
(percentile ≈ 100%; z ≈ 5.66).
Day
Max 15'
Max 60'
Max 24h
2026-09-03
4.0
6.4
31.8
2026-09-04
13.6
35.2
128.8
2026-09-05
7.0
24.4
124.0
2026-09-06
9.2
10.0
51.8
2026-09-07
15.8
33.8
50.6
2026-09-08
10.4
31.6
141.4
2026-09-09
3.2
3.6
109.2
2026-09-10
0.0
0.0
5.8
Baie Lazare, Primary School (ID 160369)
Episode peaks (rolling):
15 min = 7.4 mm at 2026-09-03 02:00;
60 min = 12.4 mm at 2026-09-03 02:30;
24 h = 28.0 mm at 2026-09-03 04:45.
Phase peaks of rolling 24 h:
Phase 1 = 28.0 mm;
Phase 2 = nan mm.
Climatology of daily maximum of rolling 24-h rainfall
(n=1147):
mean=12.24 mm; σ=23.02 mm; var=530.04;
Q20/Q40/Q60/Q80 =
0.0/1.0/4.8/18.1 mm.
Episode day-max 24 h = 28.0 mm
(percentile ≈ 86%; z ≈ 0.68).
Day
Max 15'
Max 60'
Max 24h
2026-09-03
7.4
12.4
28.0
Belombre, PUC Desalination Plant (ID 160488)
Episode peaks (rolling):
15 min = 20.6 mm at 2026-09-08 05:00;
60 min = 42.0 mm at 2026-09-08 05:15;
24 h = 148.2 mm at 2026-09-08 09:45.
Phase peaks of rolling 24 h:
Phase 1 = 84.0 mm;
Phase 2 = 148.2 mm.
Climatology of daily maximum of rolling 24-h rainfall
(n=1149):
mean=12.22 mm; σ=22.16 mm; var=490.97;
Q20/Q40/Q60/Q80 =
0.0/1.2/5.4/18.4 mm.
Episode day-max 24 h = 148.2 mm
(percentile ≈ 100%; z ≈ 6.14).
Day
Max 15'
Max 60'
Max 24h
2026-09-03
2.6
3.8
15.8
2026-09-04
11.6
22.8
84.0
2026-09-05
0.4
1.0
77.8
2026-09-06
3.8
10.0
20.6
2026-09-07
2.2
2.2
24.4
2026-09-08
20.6
42.0
148.2
2026-09-09
0.8
0.8
143.4
2026-09-10
0.0
0.0
1.4
Cap Ternay (ID 144017)
Episode peaks (rolling):
15 min = 0.2 mm at 2026-09-03 00:00;
60 min = 0.8 mm at 2026-09-03 00:45;
24 h = 16.2 mm at 2026-09-04 20:45.
Phase peaks of rolling 24 h:
Phase 1 = 16.2 mm;
Phase 2 = 11.8 mm.
Climatology of daily maximum of rolling 24-h rainfall
(n=1123):
mean=13.02 mm; σ=21.98 mm; var=482.97;
Q20/Q40/Q60/Q80 =
0.0/1.4/6.2/21.4 mm.
Episode day-max 24 h = 16.2 mm
(percentile ≈ 77%; z ≈ 0.14).
Day
Max 15'
Max 60'
Max 24h
2026-09-03
0.2
0.8
14.8
2026-09-04
0.2
0.8
16.2
2026-09-05
0.2
0.6
16.2
2026-09-06
0.2
0.6
11.8
2026-09-07
0.2
0.6
8.2
2026-09-08
0.2
0.8
11.8
2026-09-09
0.2
0.4
11.2
2026-09-10
0.2
0.2
4.4
La Digue L’union Estate (ID 235303)
Episode peaks (rolling):
15 min = 16.2 mm at 2026-09-03 21:00;
60 min = 31.0 mm at 2026-09-03 21:15;
24 h = 154.0 mm at 2026-09-04 09:15.
Phase peaks of rolling 24 h:
Phase 1 = 154.0 mm;
Phase 2 = 53.2 mm.
Climatology of daily maximum of rolling 24-h rainfall
(n=10):
mean=10.34 mm; σ=11.31 mm; var=127.98;
Q20/Q40/Q60/Q80 =
0.0/6.8/12.4/15.2 mm.
Episode day-max 24 h = 154.0 mm
(percentile ≈ 100%; z ≈ 12.70).
Day
Max 15'
Max 60'
Max 24h
2026-09-03
16.2
31.0
123.6
2026-09-04
10.8
31.0
154.0
2026-09-05
9.0
11.6
54.8
2026-09-06
12.6
17.4
50.0
2026-09-07
3.2
7.0
53.2
2026-09-08
4.8
14.4
35.6
2026-09-09
0.8
1.8
29.0
2026-09-10
0.0
0.0
1.8
La Gogue, PUC Dam (ID 160481)
Episode peaks (rolling):
15 min = 18.4 mm at 2026-09-08 05:00;
60 min = 39.2 mm at 2026-09-04 09:15;
24 h = 81.2 mm at 2026-09-08 09:30.
Phase peaks of rolling 24 h:
Phase 1 = 61.4 mm;
Phase 2 = 81.2 mm.
Climatology of daily maximum of rolling 24-h rainfall
(n=1116):
mean=9.34 mm; σ=19.92 mm; var=396.69;
Q20/Q40/Q60/Q80 =
0.0/0.2/2.6/11.2 mm.
Episode day-max 24 h = 81.2 mm
(percentile ≈ 98%; z ≈ 3.61).
Day
Max 15'
Max 60'
Max 24h
2026-09-03
0.0
0.0
0.0
2026-09-04
14.0
39.2
61.4
2026-09-05
2.6
2.8
61.4
2026-09-06
6.2
15.2
26.0
2026-09-07
14.6
19.2
42.0
2026-09-08
18.4
38.8
81.2
2026-09-09
0.8
1.0
63.0
2026-09-10
0.4
0.4
2.2
La Misere (ID 160495)
Episode peaks (rolling):
15 min = 16.6 mm at 2026-09-07 10:45;
60 min = 31.0 mm at 2026-09-08 06:30;
24 h = 136.0 mm at 2026-09-08 09:30.
Phase peaks of rolling 24 h:
Phase 1 = 87.6 mm;
Phase 2 = 136.0 mm.
Climatology of daily maximum of rolling 24-h rainfall
(n=1063):
mean=14.24 mm; σ=22.51 mm; var=506.64;
Q20/Q40/Q60/Q80 =
0.0/2.2/8.0/24.8 mm.
Episode day-max 24 h = 136.0 mm
(percentile ≈ 100%; z ≈ 5.41).
Day
Max 15'
Max 60'
Max 24h
2026-09-03
3.4
5.4
33.8
2026-09-04
7.0
14.8
87.6
2026-09-05
9.2
15.4
77.2
2026-09-06
10.2
15.6
60.6
2026-09-07
16.6
26.4
60.8
2026-09-08
10.6
31.0
136.0
2026-09-09
0.8
1.2
105.0
2026-09-10
0.6
0.8
2.0
Le Niole, PUC Water Treatment Plant (ID 182638)
Episode peaks (rolling):
15 min = 17.4 mm at 2026-09-08 04:45;
60 min = 42.2 mm at 2026-09-08 06:45;
24 h = 168.8 mm at 2026-09-09 04:45.
Phase peaks of rolling 24 h:
Phase 1 = 108.0 mm;
Phase 2 = 167.6 mm.
Climatology of daily maximum of rolling 24-h rainfall
(n=1172):
mean=14.25 mm; σ=25.23 mm; var=636.56;
Q20/Q40/Q60/Q80 =
0.0/1.4/6.4/24.1 mm.
Episode day-max 24 h = 168.8 mm
(percentile ≈ 100%; z ≈ 6.13).
Day
Max 15'
Max 60'
Max 24h
2026-09-03
3.4
4.8
22.6
2026-09-04
11.6
31.2
108.0
2026-09-05
6.0
6.6
101.0
2026-09-06
12.6
13.6
35.6
2026-09-07
3.2
3.2
36.2
2026-09-08
17.4
42.2
167.6
2026-09-09
1.4
1.6
168.8
2026-09-10
0.6
0.6
115.6
Machabee, PUC Pump Station (ID 141341)
Episode peaks (rolling):
15 min = 13.2 mm at 2026-09-04 09:15;
60 min = 36.4 mm at 2026-09-04 09:15;
24 h = 101.2 mm at 2026-09-04 12:45.
Phase peaks of rolling 24 h:
Phase 1 = 101.2 mm;
Phase 2 = 48.2 mm.
Climatology of daily maximum of rolling 24-h rainfall
(n=1113):
mean=10.23 mm; σ=21.27 mm; var=452.27;
Q20/Q40/Q60/Q80 =
0.0/0.2/2.6/15.0 mm.
Episode day-max 24 h = 101.2 mm
(percentile ≈ 99%; z ≈ 4.28).
Day
Max 15'
Max 60'
Max 24h
2026-09-03
3.2
5.4
28.2
2026-09-04
13.2
36.4
101.2
2026-09-05
0.2
0.2
93.0
2026-09-06
9.4
11.8
20.6
2026-09-07
1.2
1.4
20.4
2026-09-08
7.0
14.4
48.2
2026-09-09
5.6
6.0
47.4
2026-09-10
0.4
0.6
7.8
Montagne Posse, Prison (ID 160574)
Episode peaks (rolling):
15 min = 0.0 mm at 2026-09-03 00:00;
60 min = 0.0 mm at 2026-09-03 00:00;
24 h = 0.0 mm at 2026-09-03 00:00.
Phase peaks of rolling 24 h:
Phase 1 = 0.0 mm;
Phase 2 = 0.0 mm.
Climatology of daily maximum of rolling 24-h rainfall
(n=1128):
mean=0.64 mm; σ=2.91 mm; var=8.48;
Q20/Q40/Q60/Q80 =
0.0/0.0/0.0/0.0 mm.
Episode day-max 24 h = 0.0 mm
(percentile ≈ 84%; z ≈ -0.22).
Day
Max 15'
Max 60'
Max 24h
2026-09-03
0.0
0.0
0.0
2026-09-04
0.0
0.0
0.0
2026-09-05
0.0
0.0
0.0
2026-09-06
0.0
0.0
0.0
2026-09-07
0.0
0.0
0.0
2026-09-08
0.0
0.0
0.0
2026-09-09
0.0
0.0
0.0
2026-09-10
0.0
0.0
0.0
Mt Josephine (ID 141336)
Episode peaks (rolling):
15 min = 13.8 mm at 2026-09-07 10:45;
60 min = 28.0 mm at 2026-09-08 06:30;
24 h = 105.6 mm at 2026-09-08 09:45.
Phase peaks of rolling 24 h:
Phase 1 = 73.6 mm;
Phase 2 = 105.6 mm.
Climatology of daily maximum of rolling 24-h rainfall
(n=1194):
mean=10.93 mm; σ=21.83 mm; var=476.45;
Q20/Q40/Q60/Q80 =
0.0/0.6/4.0/14.8 mm.
Episode day-max 24 h = 105.6 mm
(percentile ≈ 99%; z ≈ 4.34).
Day
Max 15'
Max 60'
Max 24h
2026-09-03
2.8
3.6
13.0
2026-09-04
9.0
21.6
73.6
2026-09-05
1.8
2.0
71.2
2026-09-06
7.4
11.8
36.8
2026-09-07
13.8
19.8
52.4
2026-09-08
11.2
28.0
105.6
2026-09-09
0.2
0.4
85.8
2026-09-10
0.0
0.0
0.4
Perseverance, PUC Desalination Plant (ID 160590)
Episode peaks (rolling):
15 min = 13.6 mm at 2026-09-04 08:45;
60 min = 39.8 mm at 2026-09-04 09:15;
24 h = 104.8 mm at 2026-09-04 12:30.
Phase peaks of rolling 24 h:
Phase 1 = 104.8 mm;
Phase 2 = 95.8 mm.
Climatology of daily maximum of rolling 24-h rainfall
(n=1138):
mean=11.31 mm; σ=22.48 mm; var=505.53;
Q20/Q40/Q60/Q80 =
0.0/0.4/3.0/17.5 mm.
Episode day-max 24 h = 104.8 mm
(percentile ≈ 99%; z ≈ 4.16).
Day
Max 15'
Max 60'
Max 24h
2026-09-03
3.8
5.8
17.6
2026-09-04
13.6
39.8
104.8
2026-09-05
1.6
2.2
94.0
2026-09-06
6.6
11.2
19.6
2026-09-07
13.2
26.8
44.8
2026-09-08
11.8
32.2
95.8
2026-09-09
1.2
1.2
69.8
2026-09-10
0.2
0.2
2.4
6. Commentary
Read through sliding windows, the episode still appears as a double pulse.
Short windows (15 and 60 min) highlight convective intensity timing; the 24-h window
integrates successive pulses and therefore peaks later and broader, especially during Phase 2.
Relative to the recent local climatology of daily maxima of rolling 24-h rainfall,
12 of 15 stations exceed z = 1 and 12 reach z ≥ 2 on their episode peak day —
confirming that several stations experienced rare sliding-24-h amounts for this sample
(≈ three years of Davis data).
Method notes: (1) 15-min / 60-min / 24-h values are taken as reported
(sliding); (2) no calendar-day reconstruction by summing 15-min rain;
(3) climatology uses daily maxima of each rolling field;
(4) short historical sample — percentiles are sample-relative, not 30-year normals;
(5) timestamps are those stored in the database (no extra timezone conversion).
Annex — Method
Database: davis_met_data_type_1.
Filter: minutes multiple of 15. Phases:
P1 = [2026-09-03, 2026-09-06); P2 = [2026-09-06, 2026-09-09); residual thereafter.
Network envelope = maximum over stations at each timestamp.
Quintiles at 0.20 / 0.40 / 0.60 / 0.80. z = (value − mean) / σ (ddof=1).